
High Win Rates Actually Predict Trading Account Destruction
High win rates feel great until that 13% loss costs $2,800 while your wins only make $200—professional traders know better.
Why Your 87% Win Rate Means You're About to Blow Up Your Account
Here's a question for you: Would you rather trade with an 87% win rate making $15K per month, or a 62% win rate making $12K per month?
If you picked the first option, you just chose the trader who's statistically guaranteed to destroy their account. And you're not alone. Most retail traders obsess over the same vanity metrics that feel good but predict nothing about long-term survival. Meanwhile, professional traders focus on five completely different numbers that actually matter.
Mark Anderson, a former construction worker turned zero DTE hedge fund manager, puts it perfectly: "Nobody posts their Sharpe ratio on social media. They post their daily P&L." That disconnect between what gets celebrated and what creates sustainable success is why 90% of retail traders fail within their first year.
Let me show you why those feel-good numbers are setting you up for disaster, and what the professionals actually measure instead.
The Deadly Deception of High Win Rates
That 87% win rate trader I mentioned? Their average winning trade nets $200. Their average losing trade costs $2,800. Do the math on that 13% failure rate and you'll see the problem immediately.
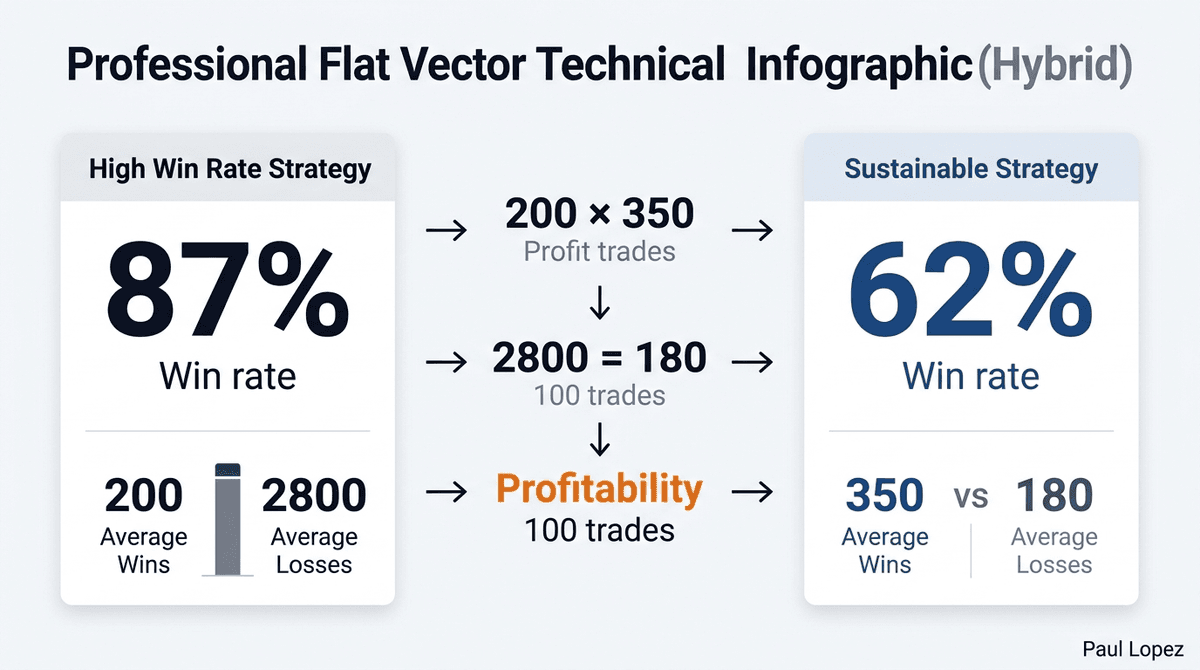
Compare that to the 62% win rate trader: $350 average wins against $180 average losses. Even with more frequent losses, their risk profile is completely different. One bad week won't destroy them. The high win rate trader? They're one market crash away from complete ruin.
This is the trading equivalent of thinking you're a great driver because you've never been in an accident, while ignoring the fact that you text while driving 80 mph in a school zone. The absence of frequent losses doesn't indicate skill. It often indicates catastrophic risk-taking that hasn't been punished yet.
The psychology here is pure slot machine mechanics. High win rates feel incredible. Every green day validates your intelligence and feeds your ego. But as Anderson notes from his hedge fund experience: "Most retail traders, their Sharpe is below 0.5." They're optimizing for feelings, not results.
The Five Metrics That Actually Predict Success
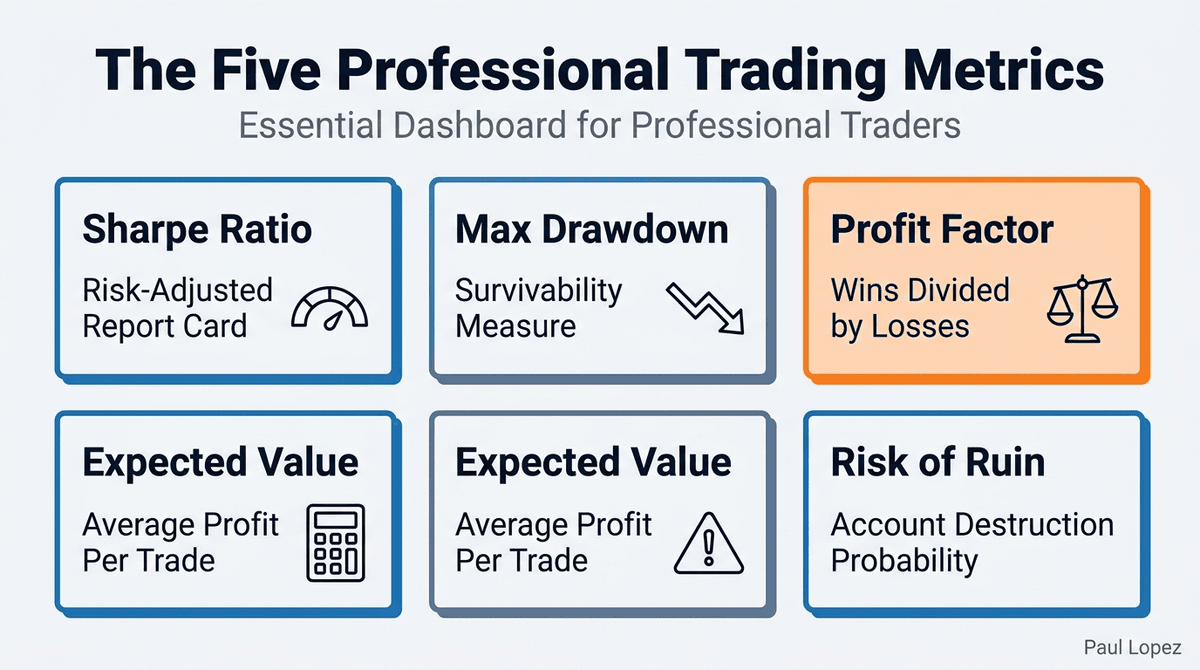
Professional traders ignore win rates almost entirely. Instead, they focus on five risk-adjusted performance indicators that separate sustainable edge from temporary luck.
Sharpe Ratio is your risk-adjusted report card. The formula is simple: (Average return minus risk-free rate) divided by standard deviation of returns. Above 1.0 is decent. Above 2.0 separates professionals from amateurs. This single number tells you whether your returns justify the volatility you're accepting.
Max Drawdown measures survivability during your worst losing streak. Here's the brutal math: a 33% drawdown requires a 50% gain just to break even. Anderson's observation from managing institutional money: "Traders never recover from that type of stuff." Your win rate doesn't matter if you can't survive your worst month.
Profit Factor divides total wins by total losses. Anything above 1.5 means you can be profitable even with a 40% win rate. This metric reveals whether your edge is real or illusory. A profit factor of 0.8 with a 70% win rate? You're still losing money, just slowly.
Expected Value Per Trade is the average profit per trade over hundreds of executions. Anderson calls this "the only number that scales." Win rates fluctuate. Daily P&L varies wildly. But expected value per trade allows you to forecast performance based on volume and predict whether increased position size makes sense.
Risk of Ruin calculates the probability of complete account destruction given your current strategy. This distinguishes investing from gambling. A 15% risk of ruin means that out of 100 traders using your exact approach, 15 will lose everything. Professional money demands this number stay below 2%.
Why Smart People Ignore Smart Metrics
The metrics that matter most are also the hardest to celebrate. Try posting your quarterly Sharpe ratio improvement on Instagram and watch the crickets chirp. Meanwhile, screenshot a $3,000 day and the dopamine hits immediately.
Social media has gamified the wrong outcomes. We get validation for daily wins, not risk-adjusted consistency. This creates a feedback loop where traders optimize their strategy for content creation rather than wealth creation.
There's also a systems problem. Most retail platforms don't calculate these metrics automatically. TradingView shows your daily P&L in bright green or red, but finding your profit factor requires manual spreadsheet work. The tools emphasize what's immediate and emotional rather than what's predictive and rational.
Anderson's insight from hedge fund management cuts deep: "The traders who survive long-term compete with their past performance, not with social media." Professional money gets allocated based on multi-year Sharpe ratios and maximum drawdown statistics. Retail traders optimize for weekly validation.
Building Your Professional Dashboard
The transition from gambler to professional starts with measurement infrastructure. Every single trade needs documentation: entry price, exit price, position size, P&L, and most importantly, your thesis for why the trade made sense.
Weekly analysis becomes non-negotiable. Calculate your profit factor by dividing total gains by total losses. Track your maximum drawdown from peak equity. Compute expected value per trade by dividing total P&L by number of trades. These numbers tell you whether you're improving or just getting lucky.
Risk management has to be systematic, not emotional. Anderson recommends maximum 1% risk per trade and 3% maximum daily loss limits. These constraints force position sizing discipline and prevent the emotional escalation that destroys accounts.
Backtesting validates theoretical edge before risking real money. If your strategy can't produce a positive expected value per trade over historical data, live trading becomes expensive hope rather than calculated probability.
The goal shifts from daily profit targets to quarterly metric improvement. Can you increase your Sharpe ratio from 0.6 to 1.2? Can you reduce maximum drawdown from 15% to 8%? These improvements compound over years rather than weeks.
The Professional Mindset Shift
Here's what separates sustainable traders from gambling addicts disguised as investors: professionals focus on process metrics that predict long-term results rather than outcome metrics that provide short-term validation.
Your 87% win rate doesn't impress institutional money if your risk-adjusted returns are terrible. Your daily P&L screenshots don't matter if your expected value per trade is negative. Professional success requires optimizing for numbers that feel boring but create lasting wealth.
The question isn't whether you can string together a few good months. The question is whether your metrics predict success over hundreds of trades and multiple market cycles. Can you survive 2008? Can you adapt to changing volatility regimes? Can you scale your approach as account size grows?
Start tracking the metrics that matter. Calculate your current Sharpe ratio and maximum drawdown. Build systems that emphasize process over outcomes. Compete with your past performance, not social media highlight reels.
Your account balance will thank you, even if Instagram doesn't.
References
[1] Anderson, Mark. "The 5 Metrics That Actually Matter in 0DTE (Not Win Rate)" YouTube Transcript. [Hedge fund manager with 1,000+ consecutive trading days, $100M+ premium sold]